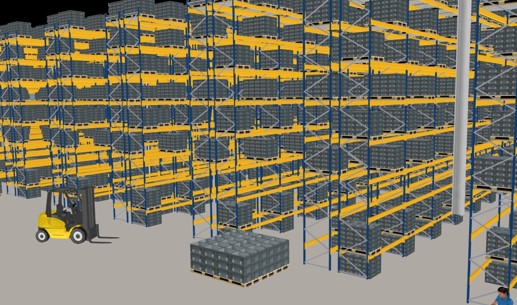
The question of when to invest in warehouse automation technology is a challenge for many supply chain decision makers today. 4flow examined the key cost and performance drivers for warehouse automation, labor and equipment costs, demand patterns and operational constraints using a simulation model.

Request study in PDF format

REQUEST FREE COPY

Purpose and framework

Several uncertainties usually come with long-term decisions such as warehouse automation projects. In our interactive model, you can change these parameters to understand the interplay between them and evaluate whether an investment would make sense for you. For more context, we invite you to download our study on the topic.

Numerous technological varieties and functionalities are currently available. Based on a case study with real-world data, we compare a manual forklift solution with stacker cranes and an automated solution with automated guided vehicles for storage, retrieval and transport. The objective is to compare the financial key performance indicator (KPI) of a payback period for both options. The payback period indicates how long it would take to reimburse the initial investment through lower operational costs.

The interactive framework allows you to assess the influence of certain factors on the payback period of an automated warehouse. The model is based on optimally designed layouts of manual and automated warehouses, which were derived from a case study based on real-world data and a service level requirement assumption of 98.5% (γ service level).​

Model baseline framework
  • Process in scope: storage, retrieval and internal transport
  • Technologies: forklifts (manual) and a combination of stacker cranes and automated guided vehicles (automated)
  • Target service level: 98.5%
  • Handling units: pallets
  • Average pallet movements per day: 4,900
  • Daily throughput capacity: 6,600 pallet movements
  • Number of pallet storage locations: 17,000
  • Labor cost: €20.5 per hour
  • Investment cost: €3 million (manual) and €9 million (automated)
  • Warehouse rent: €60 per square meter (manual) and €100 per square meter (automated)
Automated solution
Manual solution

Demand volatility affects the service level

Automated warehouse technologies can come with flexibility constraints, which is especially important in environments of volatile demand. Our demand scenarios show how increasing volatility and inflexible capacities can jeopardize the required service levels.
Lever
Demand volatility indicates how much the daily demand deviates from the average demand and is measured with a coefficient of variation. Demand volatility directly impacts service level fulfillment.
Demand volatility
low
baseline
high
Service level analysis

Stock-out costs quantify capacity bottlenecks

Quantifying the costs of a stock-out is not an easy task, and companies tend to have their own individual estimates. Since internal and external factors with possibly poor data quality have to be considered, investigating a range of assumptions is crucial.
Lever
The stock-out cost are described as a percentage of the value of goods that cannot be taken from the warehouse due to insufficient throughput capacity. Stock-out costs directly impact the payback period.
Demand volatility
low
baseline
high
Stock out cost
low
baseline
high
Payback period under demand volatility
Payback period

Labor cost and rent influence the profitability

The higher the labor costs, the more competitive the automated warehouses are compared to manual, labor-intensive warehouses. Together with warehouse rent, these location-specific cost drivers are operational costs.
Lever
Labor costs are subject to multiple external and internal factors, while warehouse rent is typically higher in attractive supply chain regions.
Warehouse rent
low
baseline
high
Labor cost
low
baseline
high
Labor cost and rent
Payback period

Investment cost and performance parameters

Automation comes with a high initial investment in technology. Streamlining the warehouse’s performance is critical for cost considerations – in this context, dual command enables put-away and retrieval to be carried out in a single process step. The higher the amount of dual commands, the higher the operation's efficiency.
Lever
Technology investments can vary between different providers. The dual command ratio is usually determined by order structure, inventory strategy and technology.
Dual command
low
baseline
high
Investment cost
low
baseline
high
Investment cost and dual command
Payback period

Summary of your configuration

You’ve explored all of the relevant influencing factors in our model framework. Below, you can re-adjust all your settings, investigate and compare the impact on the payback period for all possible scenarios.
Demand volatility
Demand volatility indicates the fluctuation in the throughput volume.
low
baseline
high
Labor cost
This shows the cost of wages.
low
baseline
high
Investment cost
Investment cost represents the price of equipment.
low
baseline
high
Stock out cost
This is the cost resulting from items in backlog.
low
baseline
high
Warehouse rent
Warehouse rent shows the regionally varying space costs.
low
baseline
high
Dual command
This is an indicator of the warehousing solution’s efficiency.
low
baseline
high
Your parameter settings reflect a case, in which the automated solution pays off after 2.6 years.
A payback period below three years would be accepted by most practitioners.
The target service level is fulfilled and the automated warehouse is suitable for this demand volatility.

Findings

Demand volatility should not be underestimated in warehouse planning. Extensively analyzing the decision of whether to automate a warehouse reveals the interdependencies between all of the other relevant influence factors. Please keep in mind that the parameter setting is only valid in the model framework. However, it allows conclusions to be drawn for your next warehouse planning project.

Does this topic interest you? Contact us to explore your individual warehouse planning challenges together. We look forward to hearing from you.

4flow research

We look forward to hearing from you.

The team behind the study

Alexander Zienau
Researcher
4flow research
Alexander Korczok
Researcher
4flow research
Wendelin Gross
Head of 4flow research
4flow research
Jan-Niklas Grafe
Manager
4flow consulting
Dr. Ina Goedicke
Principal
4flow consulting
Katharina von Helldorff
Partner
4flow consulting